6 interesting facts about moving customers

We thought it would be interesting to take a look at anonymized, aggregated data on our platform to see if the data actually matches the expectations about moving customer behavior that we expect intuitively.
1. Mobile users now represent 68% of visits to moving company websites
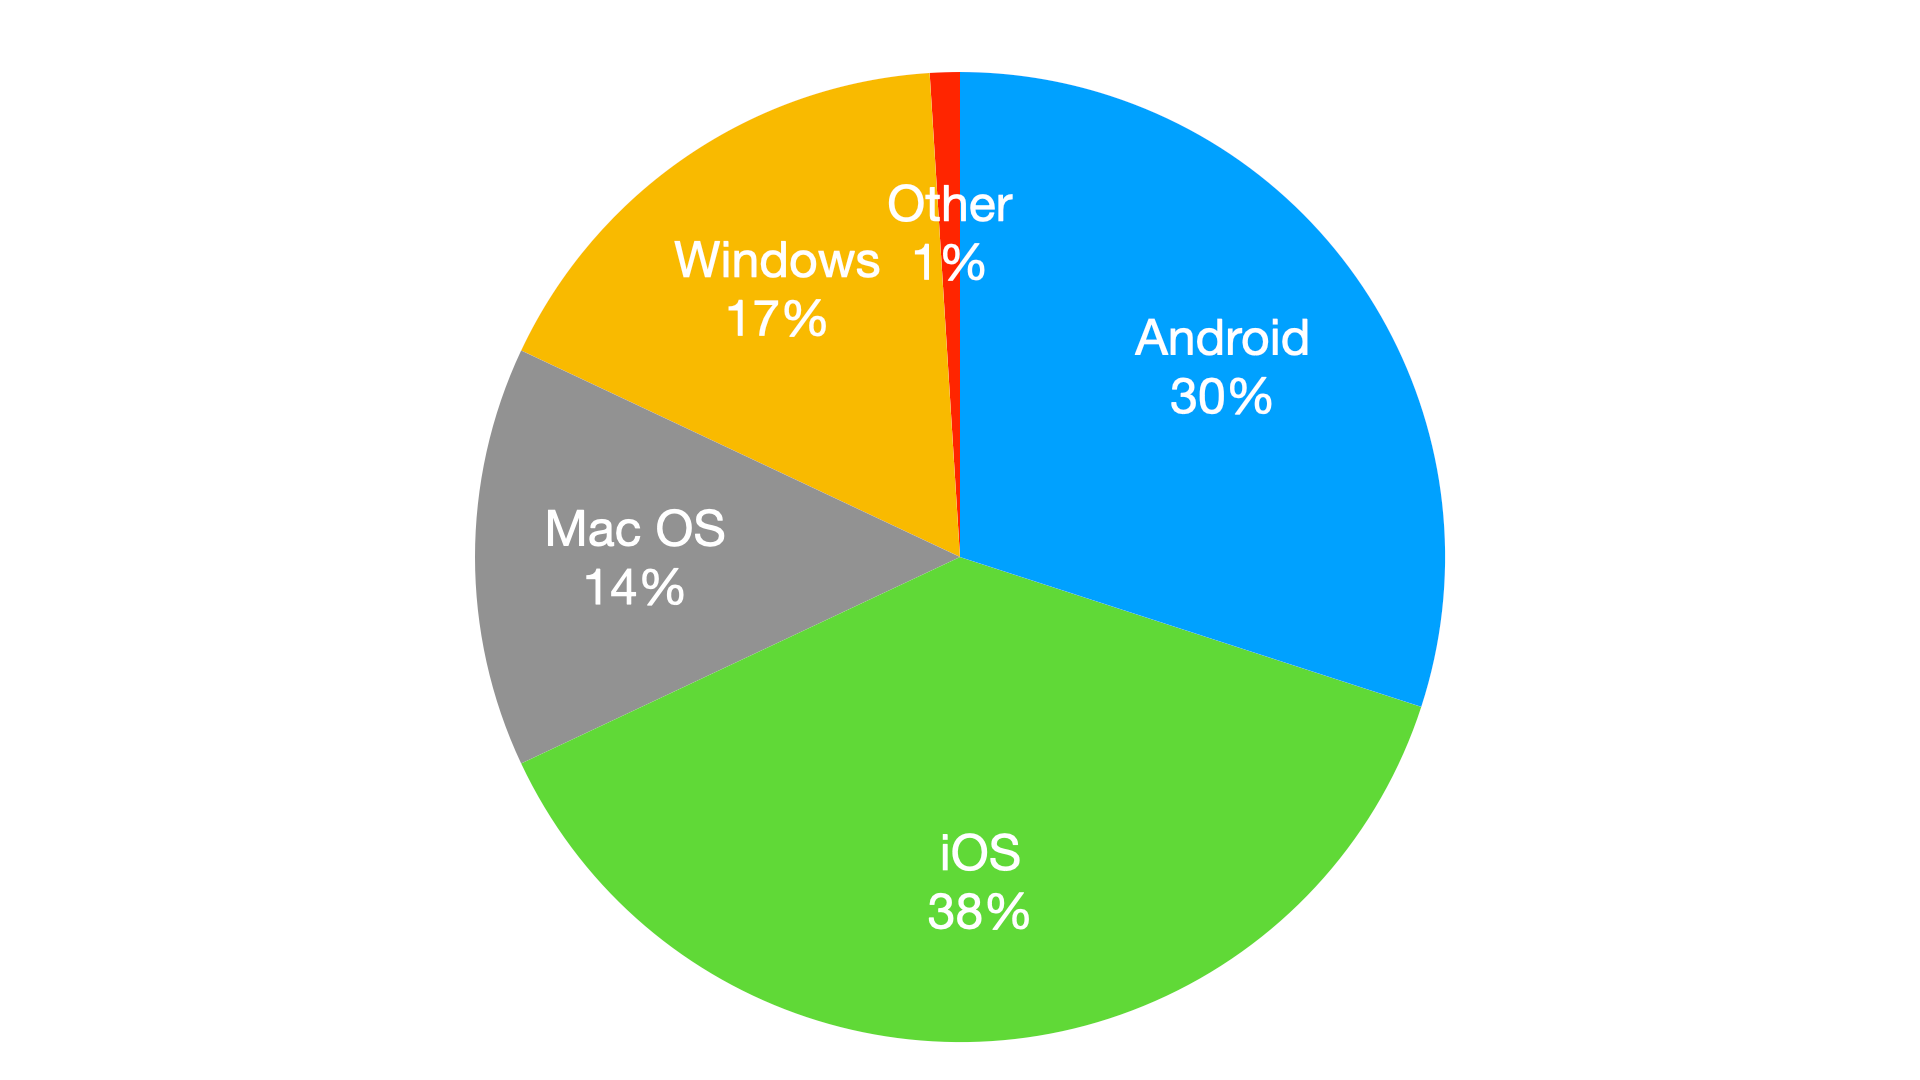
I knew this would be high, but i did not think it would be this high. We've been tracking this metric for over 8 years now since we first built the MoveNinja CRM for movers over 8 years ago. Back then (around 2012, this number hovered around 10-15%) It really shows that the technology we deploy these days must cater to mobile users first. This means everything from websites to the emails that moving customers engage with should be designed with the mobile customer in mind.
We've been tracking this metric over the years, so when we built the all new MoveBooker tools during the lockdown, we pretty much designed the screens and experiences with a mobile first perspective. Tap/Click here to preview the MoveBooker mobile experience
2. The average move is requested 25 days in advance of the desired moving date
Here are some other interesting notes on the typical days before a move is requested:
10% of requests are made within 3 days of the desired moving date
25% of requests are made within 7 days of the desired moving date
50% of requests are made within 15 days of desired moving date
90% of requests are made within 60 days of the desired moving date
3. Saturday is the most desirable moving day of the week
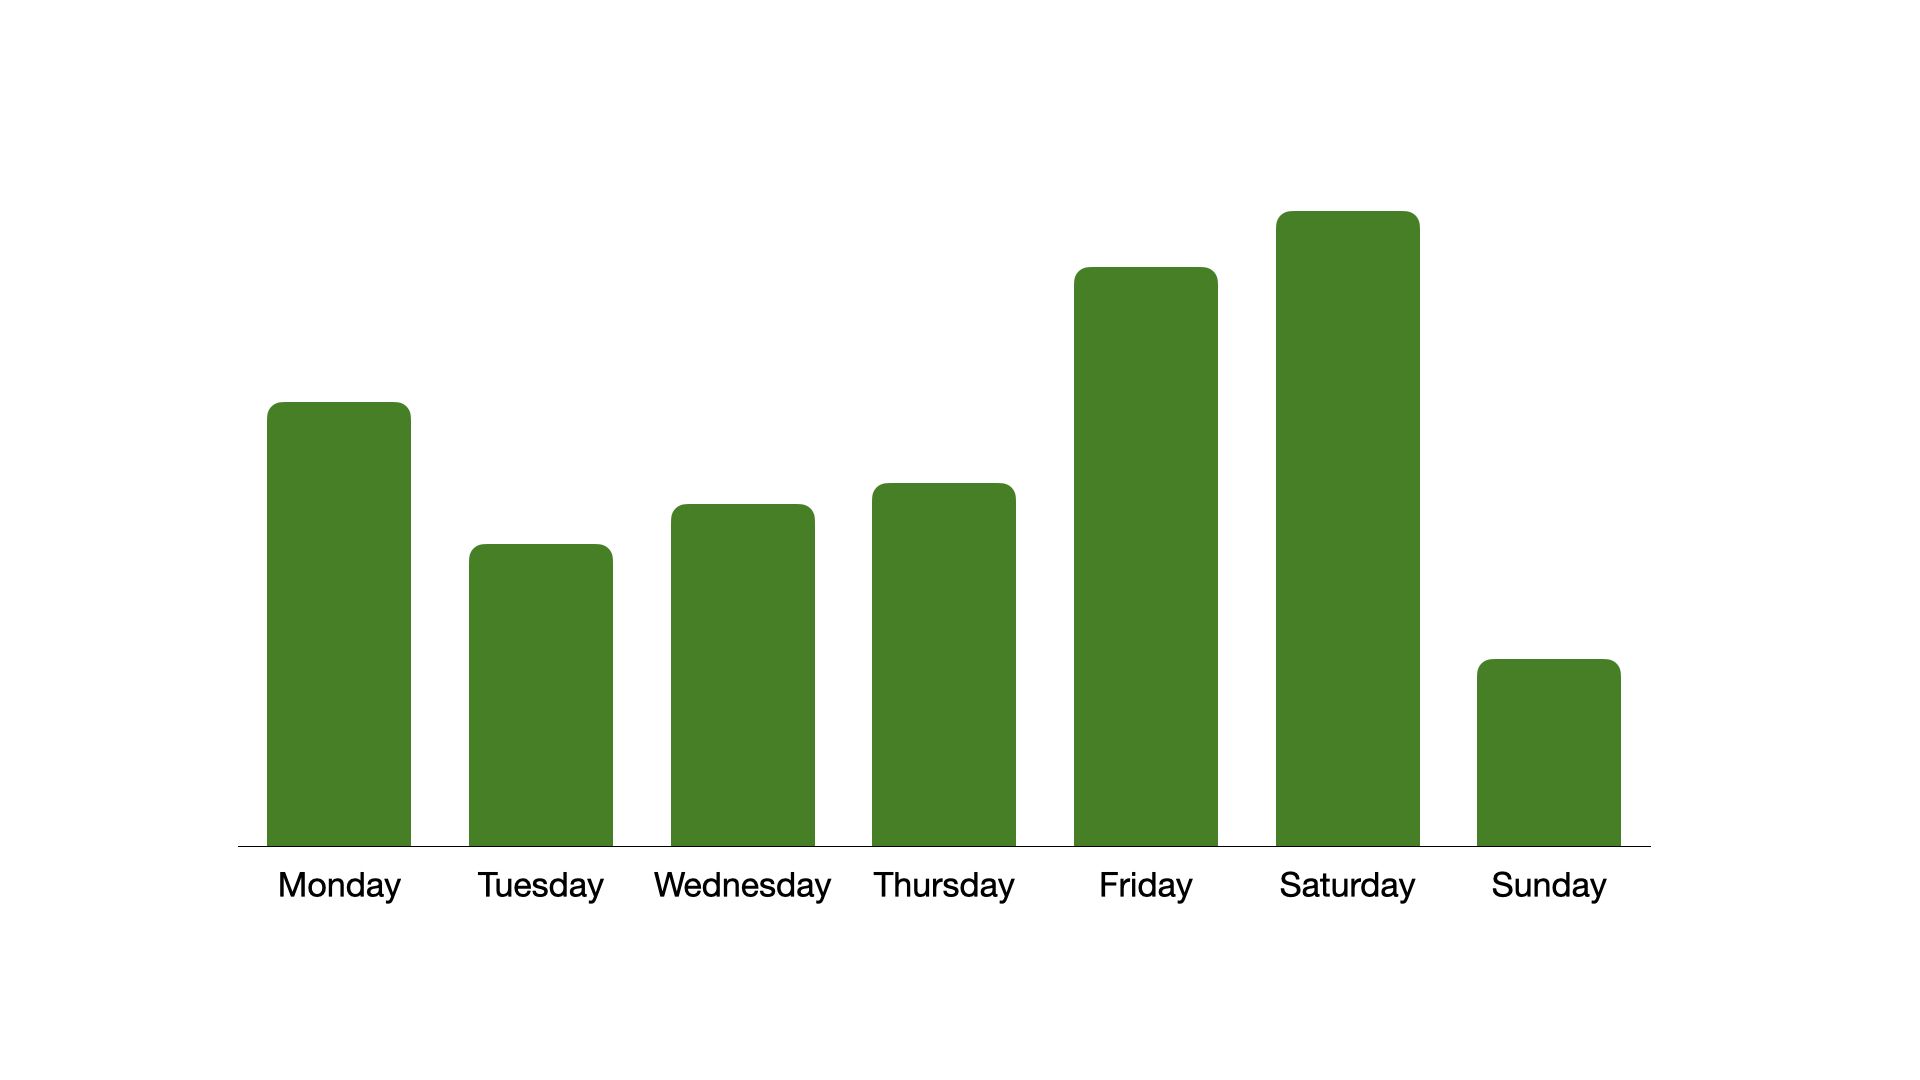
Saturday being the most popular moving date won't surprise any movers as this is when most people are free from their work schedules to focus on coordinating with their movers
4. Most moves are requested on Mondays
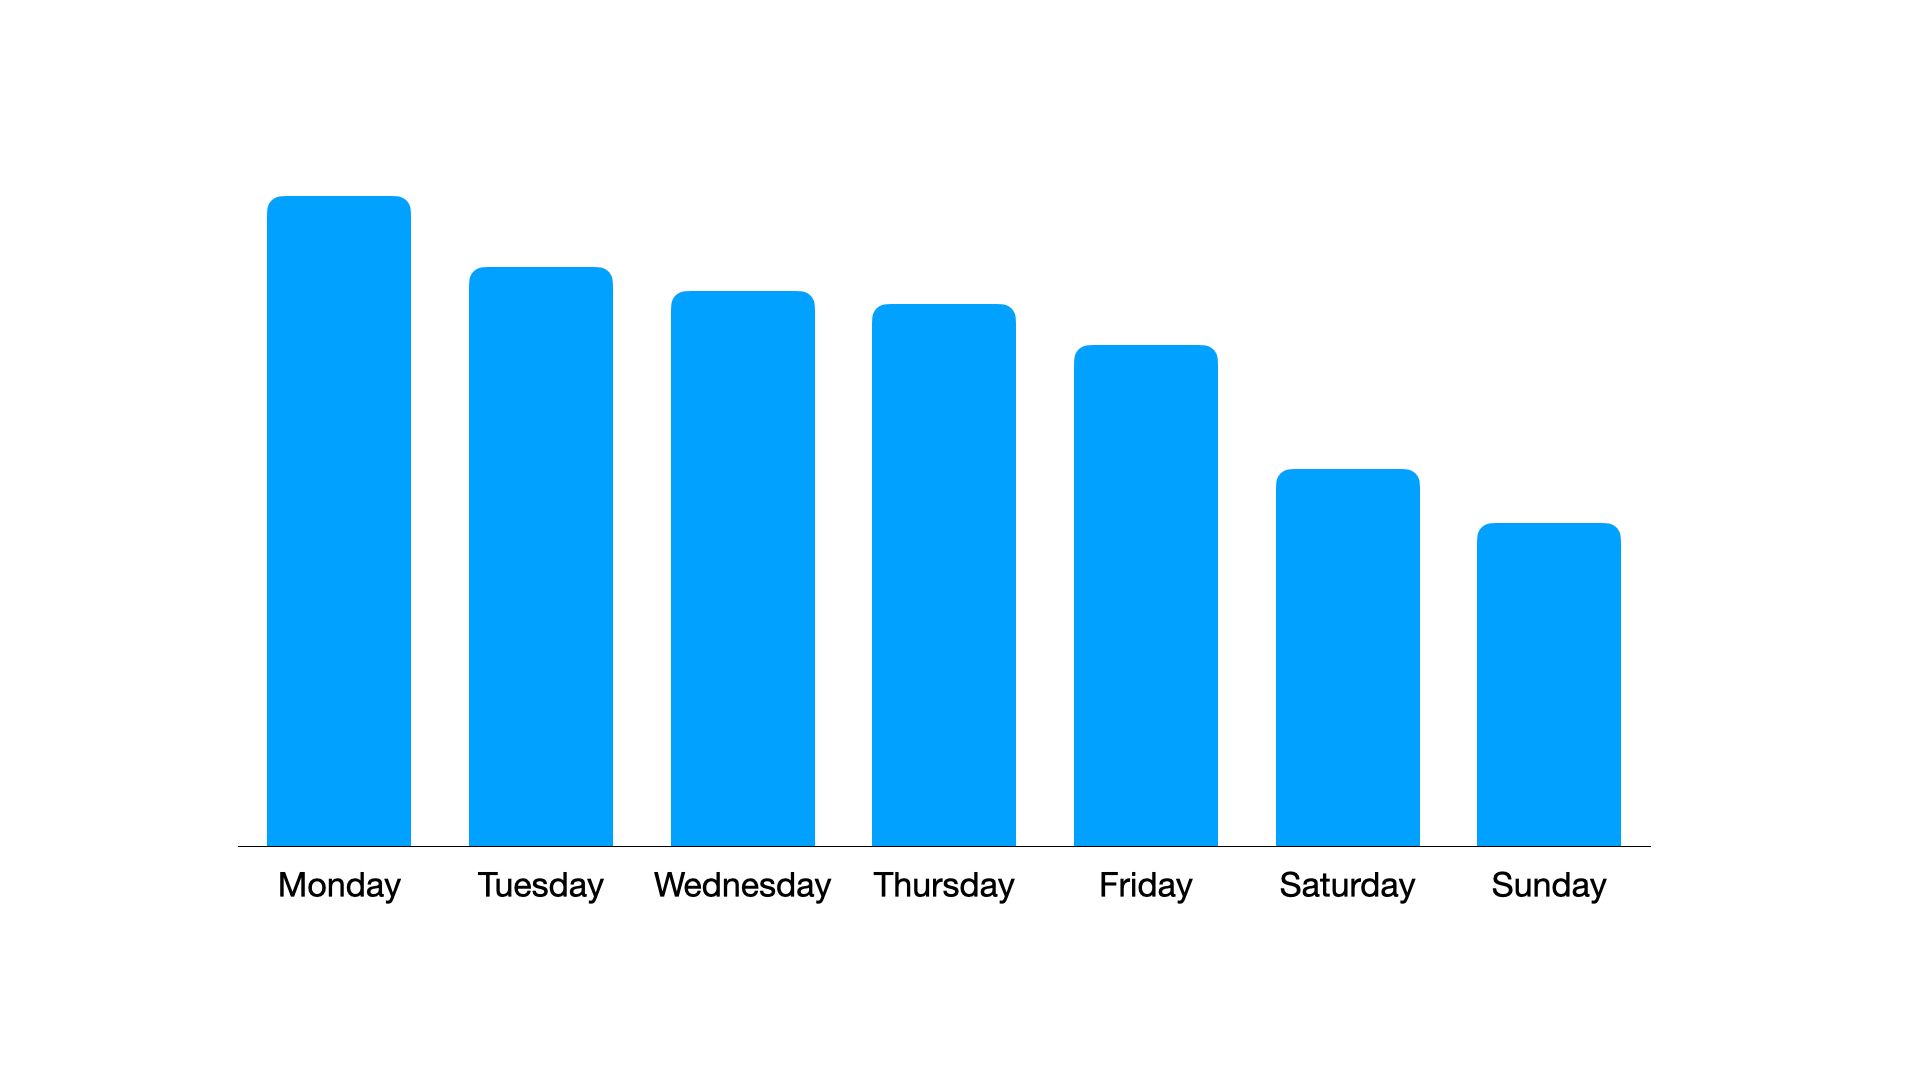
Mondays are planning days, and i guess it makes sense that a majority of moving customers would dedicate this day to start working with movers to get quotes and plan their moves
5. June is the busiest month for moves
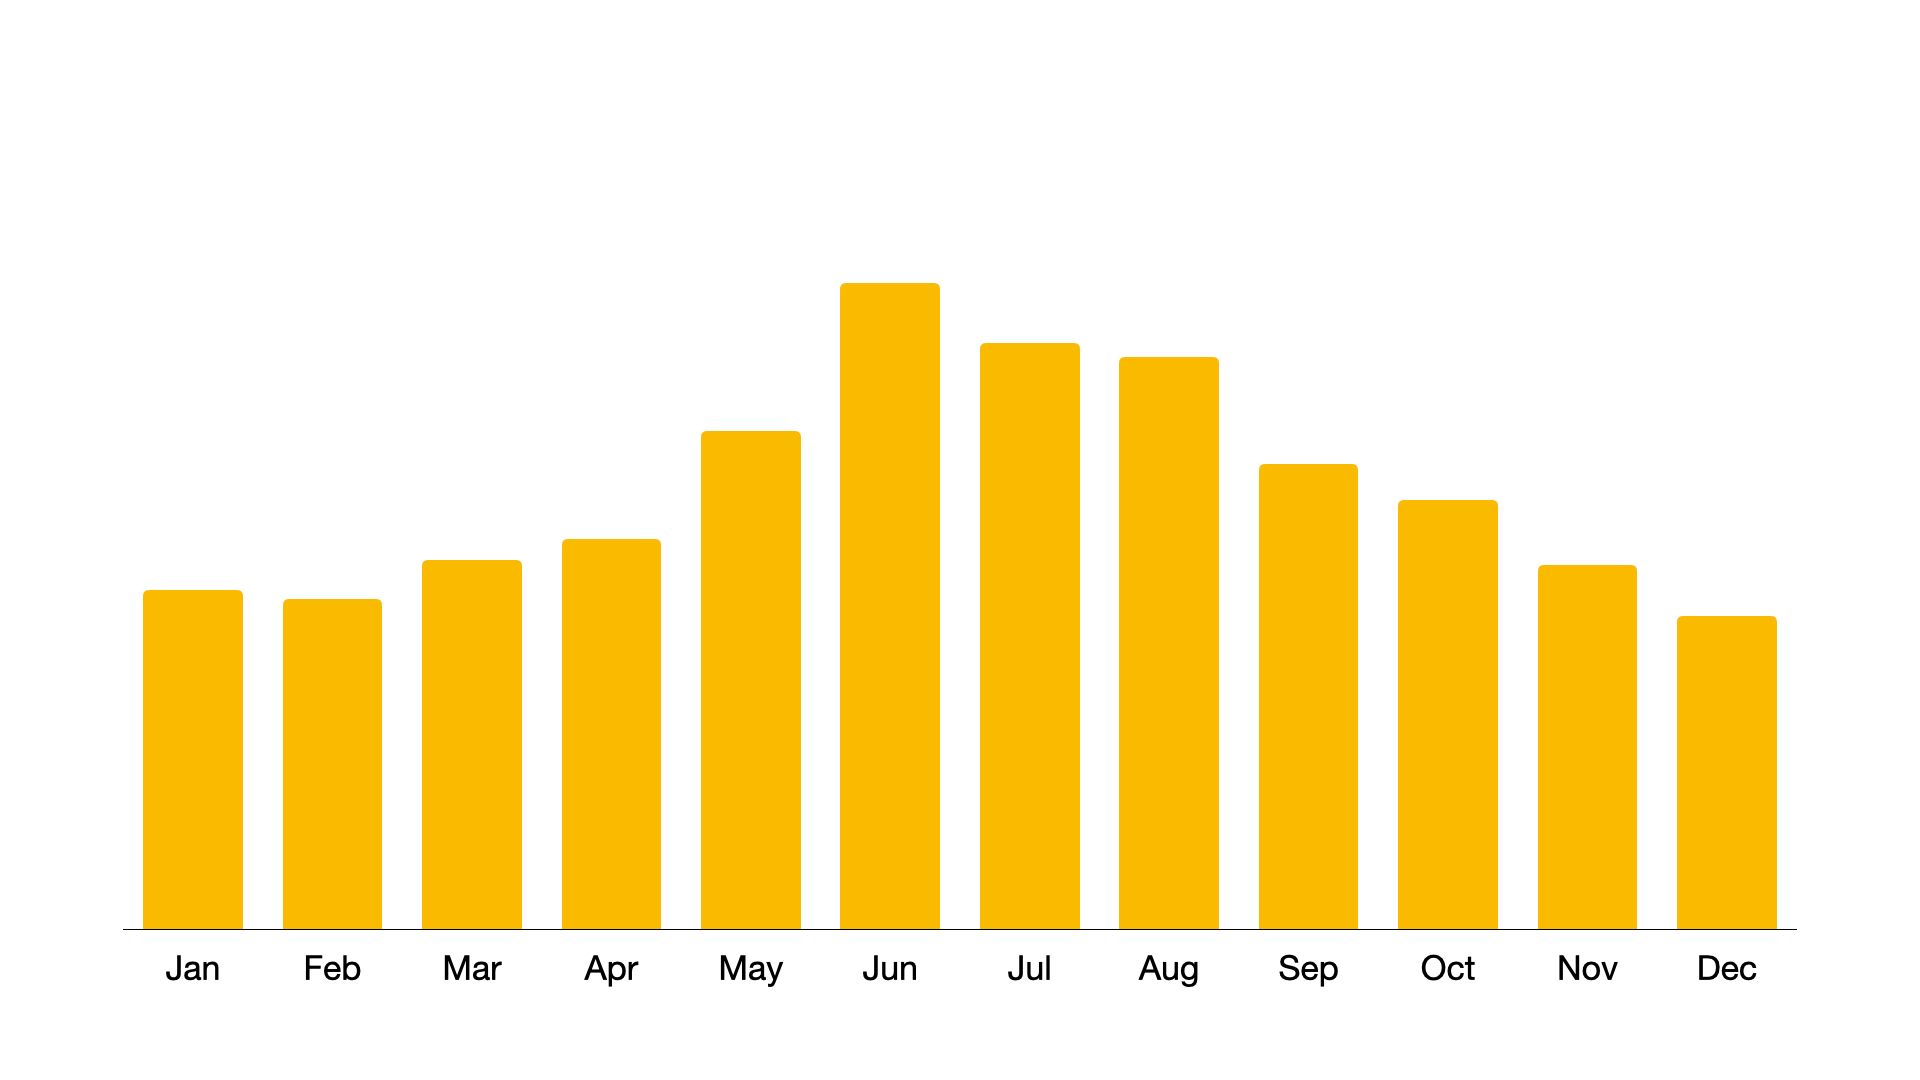
I'll admit that the chart of moving frequency by month will not surprise any experienced movers as the summer months are generally known as moving season, particularly in North America. June has almost twice the amount of moves as the month of December.
6. 1 bedroom homes are the most commonly requested move size
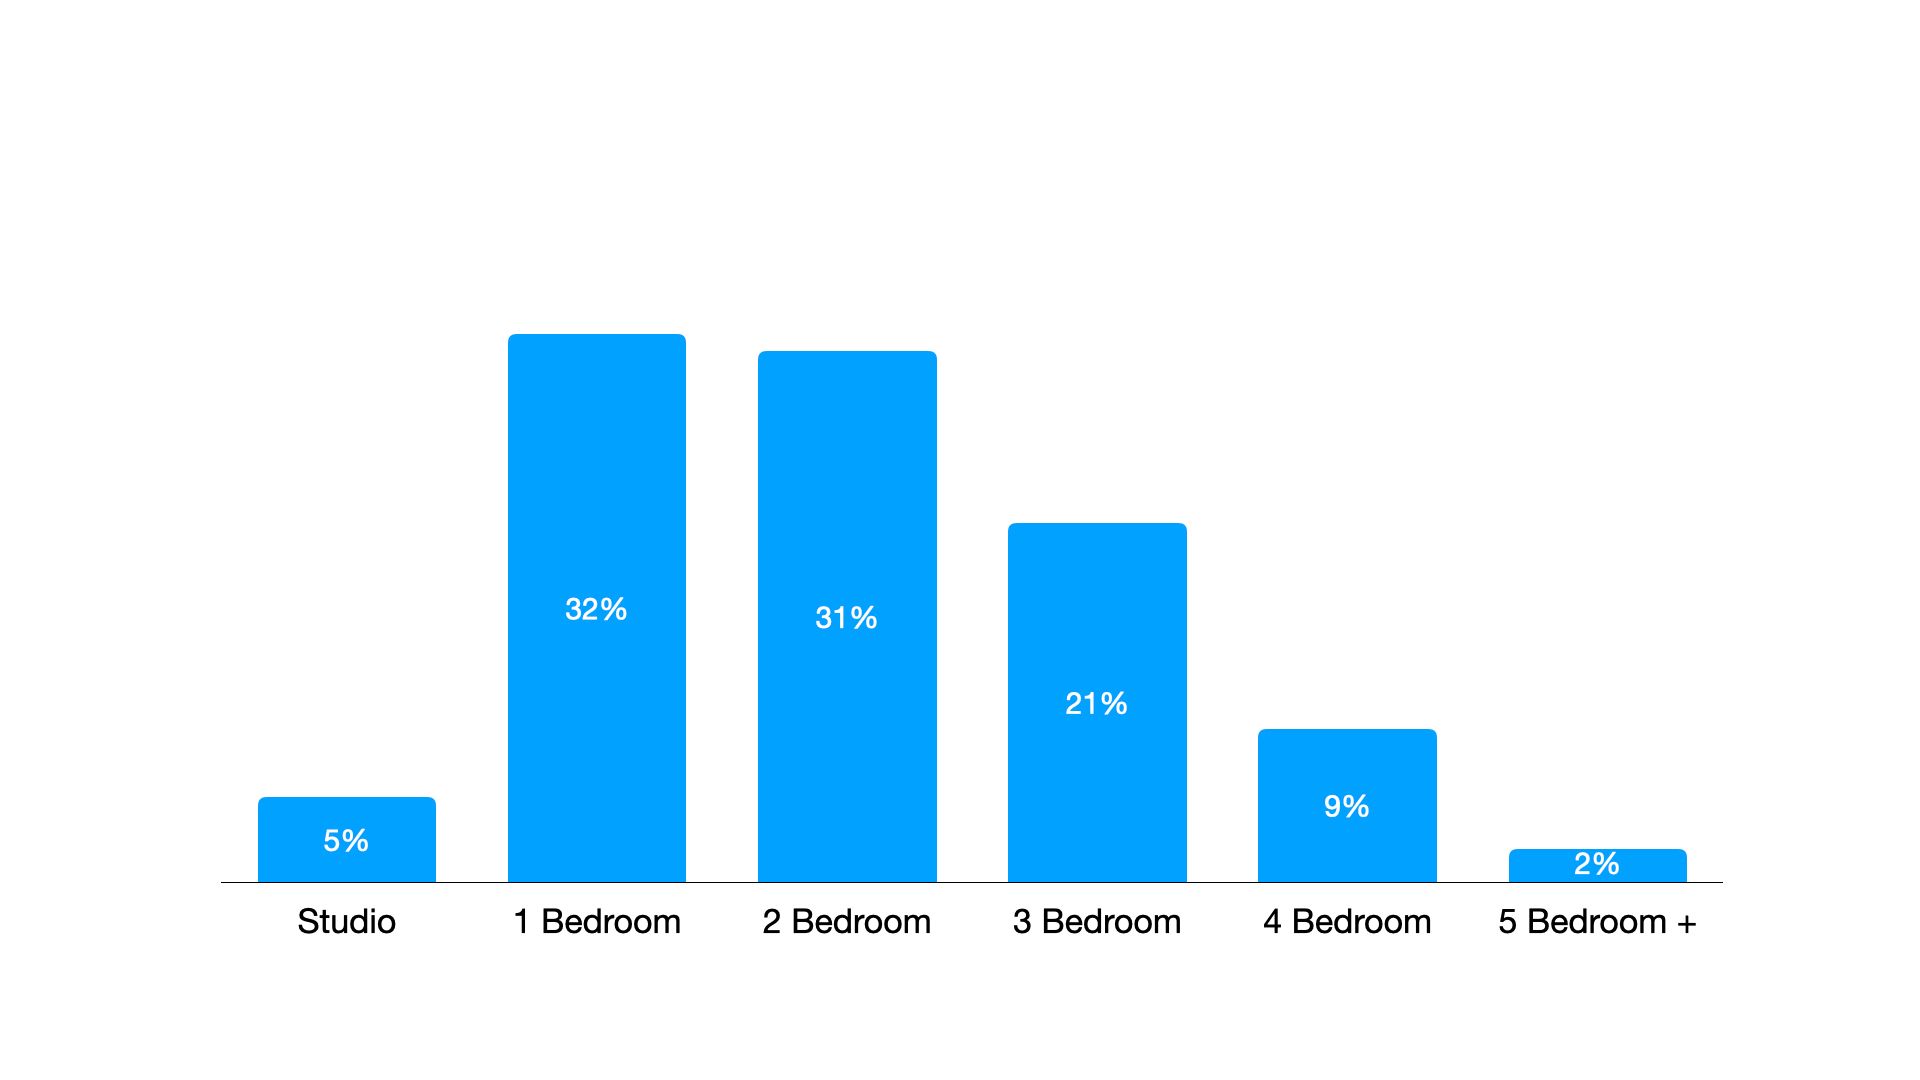
1 bedroom homes (along with 2 bedroom homes) represent the bulk of move sizes typically requested by residential movers. At 32% and 31% respectively, it's fair to say that there really isn't a big difference between the frequency of 1-2 bedroom homes as they both represent about 63% of total home moves.
Stay tuned as we're just getting started on using data to better understand the moving customer and designing booking flows in MoveBooker to help our clients book more moves in this digital age. If you would like to learn more about how we can help your moving company book more moves, feel free to reach out to us on live chat via our website at getmovebooker.com or check back here for more updates.
